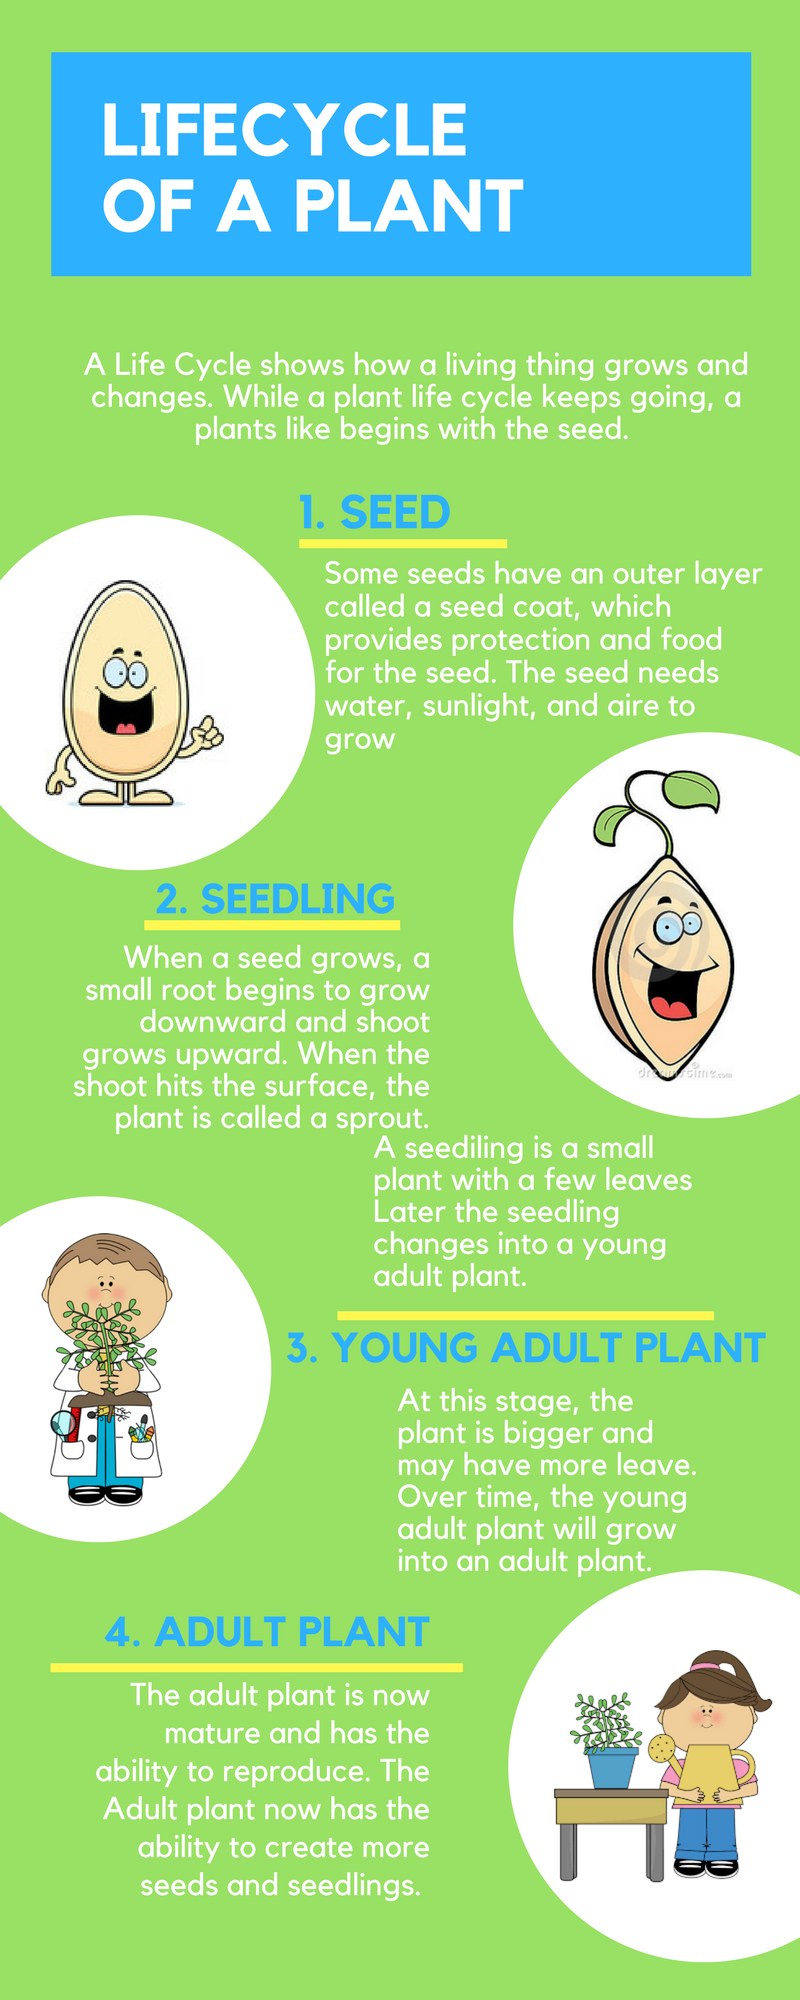
inforgraphics : The plant life cycle
Creating inforgraphics is a great way to present the most important information to your students. You can create an infographic for all different sorts of subjects and design them to specifically meet your needs. There are many different apps availible that can help you to build your infographic. Some of them include, Venngage, Canva, Easel.ly, and Picktochart. For this inforgraphic I decided to use Canva becuase it was an app that I was familiar with. Canva can be used on both your computer and iPad which is what makes it so versatile. Below is a tutorial on how to navigate this app. The one below is how to navigate it via your computer.
This next tutorial will show you how to navigate the app via your iPad.
Canva was a great app to use when creating this project. It has preset templates of inforgraphics that allow you to easily insert your own text and change the color or image that was present in the original format. I felt that this was the easiest way to complete this project. You dont have to be a graphic designer with this app it lets you easily create professional desgins in an instant. This is the perfect app when creating a poster for you classroom or adding something to the classroom blog.

You can find lots of ideas for infographics that you can create or get a design reference from on Pinterest. Here is a link to my inforgrphics pinterest board if you need a little inspiration https://www.pinterest.com/sabina1996/infographics/. Search through my pinterest and many others to help you get started on your next infographic for your class! https://www.pinterest.com/sabina1996/infographics/